Nearly all women in the United States who have ever had sexual intercourse have used a contraceptive method at some point during their reproductive years.1 Estimates presented in this report, which come from the Behavioral Risk Factor Surveillance System (BRFSS), highlight differences in the most effective contraceptive method used at last sex among U.S. women aged 18–49 who are at risk of pregnancy (i.e., those who are sexually active with one or more male partners, are not pregnant or postpartum, and have not had a hysterectomy).
In every state, the majority of women of reproductive age are using some form of contraception. Use estimates for primary methods show wide variability across the states, especially for female sterilization, IUDs, oral contraceptive pills and condoms. Among states with available data, Oregon and Utah have the highest levels of contraceptive use among women at risk of pregnancy, with more than half of women at risk of pregnancy in these two states reporting use of a highly or moderately effective method at last sex.
The BRFSS offers an opportunity to explore basic indicators of reproductive health among resident women in each U.S. state. A previous report examining contraceptive use prevalence with BRFSS data from 2017 represented the most comprehensive documentation of contraceptive use at the state level since 2004.2 This analysis builds from that report to provide updated state-level estimates of contraceptive use prevalence among women of reproductive age across the United States.
Data and Methods
The BRFSS is a surveillance system that conducts monthly cross-sectional telephone surveys in all 50 states, the District of Columbia and three U.S. territories (Guam, Puerto Rico and the U.S. Virgin Islands). The data, which are publicly available for download on the BRFSS website,3 are collected separately for each jurisdiction using complex sampling designs determined by that jurisdiction and reviewed by the Centers for Disease Control and Prevention (CDC). Landline and cell phone interviews are used to collect retrospective self-reported data from men and women aged 18 and older, and the data are representative of noninstitutionalized adult residents of each jurisdiction.
The tables in this report present basic tabulations of contraceptive method use data from the 2017 and 2019 BRFSS. In 2017, 40 jurisdictions* fielded questions relevant to contraceptive use. In 2019, the same questions were asked in 38 jurisdictions.† Estimates for the District of Columbia and Puerto Rico are included in the report’s tables, but excluded from highlighted state comparisons. We strongly discourage comparisons between states and territories because these two types of jurisdictions do not have comparable capacities for policy implementation. Our analytic sample is limited to female respondents aged 18–49 who reported having been sexually active with one or more male partners (40,406 respondents in 2017 and 36,519 respondents in 2019), by state of residence. More information on the data and methods is available below.
Contraceptive method use distributions presented here indicate the most effective method used at last sex (referred to subsequently as the "primary" method), as mentioned by respondents.‡ In line with designations used by the CDC,4 contraceptive methods were grouped by effectiveness, according to first-year typical-use failure rates, into the following categories: highly effective permanent, highly effective long-acting reversible contraceptive (LARC), moderately effective and least effective.§5,6 Appendix Table 1 shows the distribution of contraceptive method use among contraceptive users.
To account for the BRFSS’s multistage, probability-based complex sample design, we applied sampling weights that yielded prevalence estimates representative of resident women aged 18–49 within each state or territory. In addition, we used design variables for the sampling stratum and cluster to obtain correct standard errors for all estimates. Weighted estimates were calculated to determine the proportion of women who reported using contraceptives at last sex among all women and among women at risk of pregnancy. Simple logistic regression was used to compare contraceptive use prevalence within jurisdictions from 2017 to 2019 and between regions of the country in 2019. All analyses were performed using Stata version 16.1.
Highlighted Findings
Contraceptive use by all women
- Across the 37 states with available data in 2019, the majority of all women aged 18–49 reported having used a contraceptive method the last time they had sex, ranging from 59% in Hawaii to 77% in Massachusetts (Table 1).
Contraceptive use among women at risk of pregnancy
- Among the 32 states in which data were collected in both 2017 and 2019, reported contraceptive use increased between the two years among women at risk of pregnancy in nine states: Arizona, Delaware, Massachusetts, Minnesota, Missouri, Nebraska, Utah, West Virginia and Wisconsin. Women at risk of pregnancy did not report decreases in contraceptive use between these time points in any states.
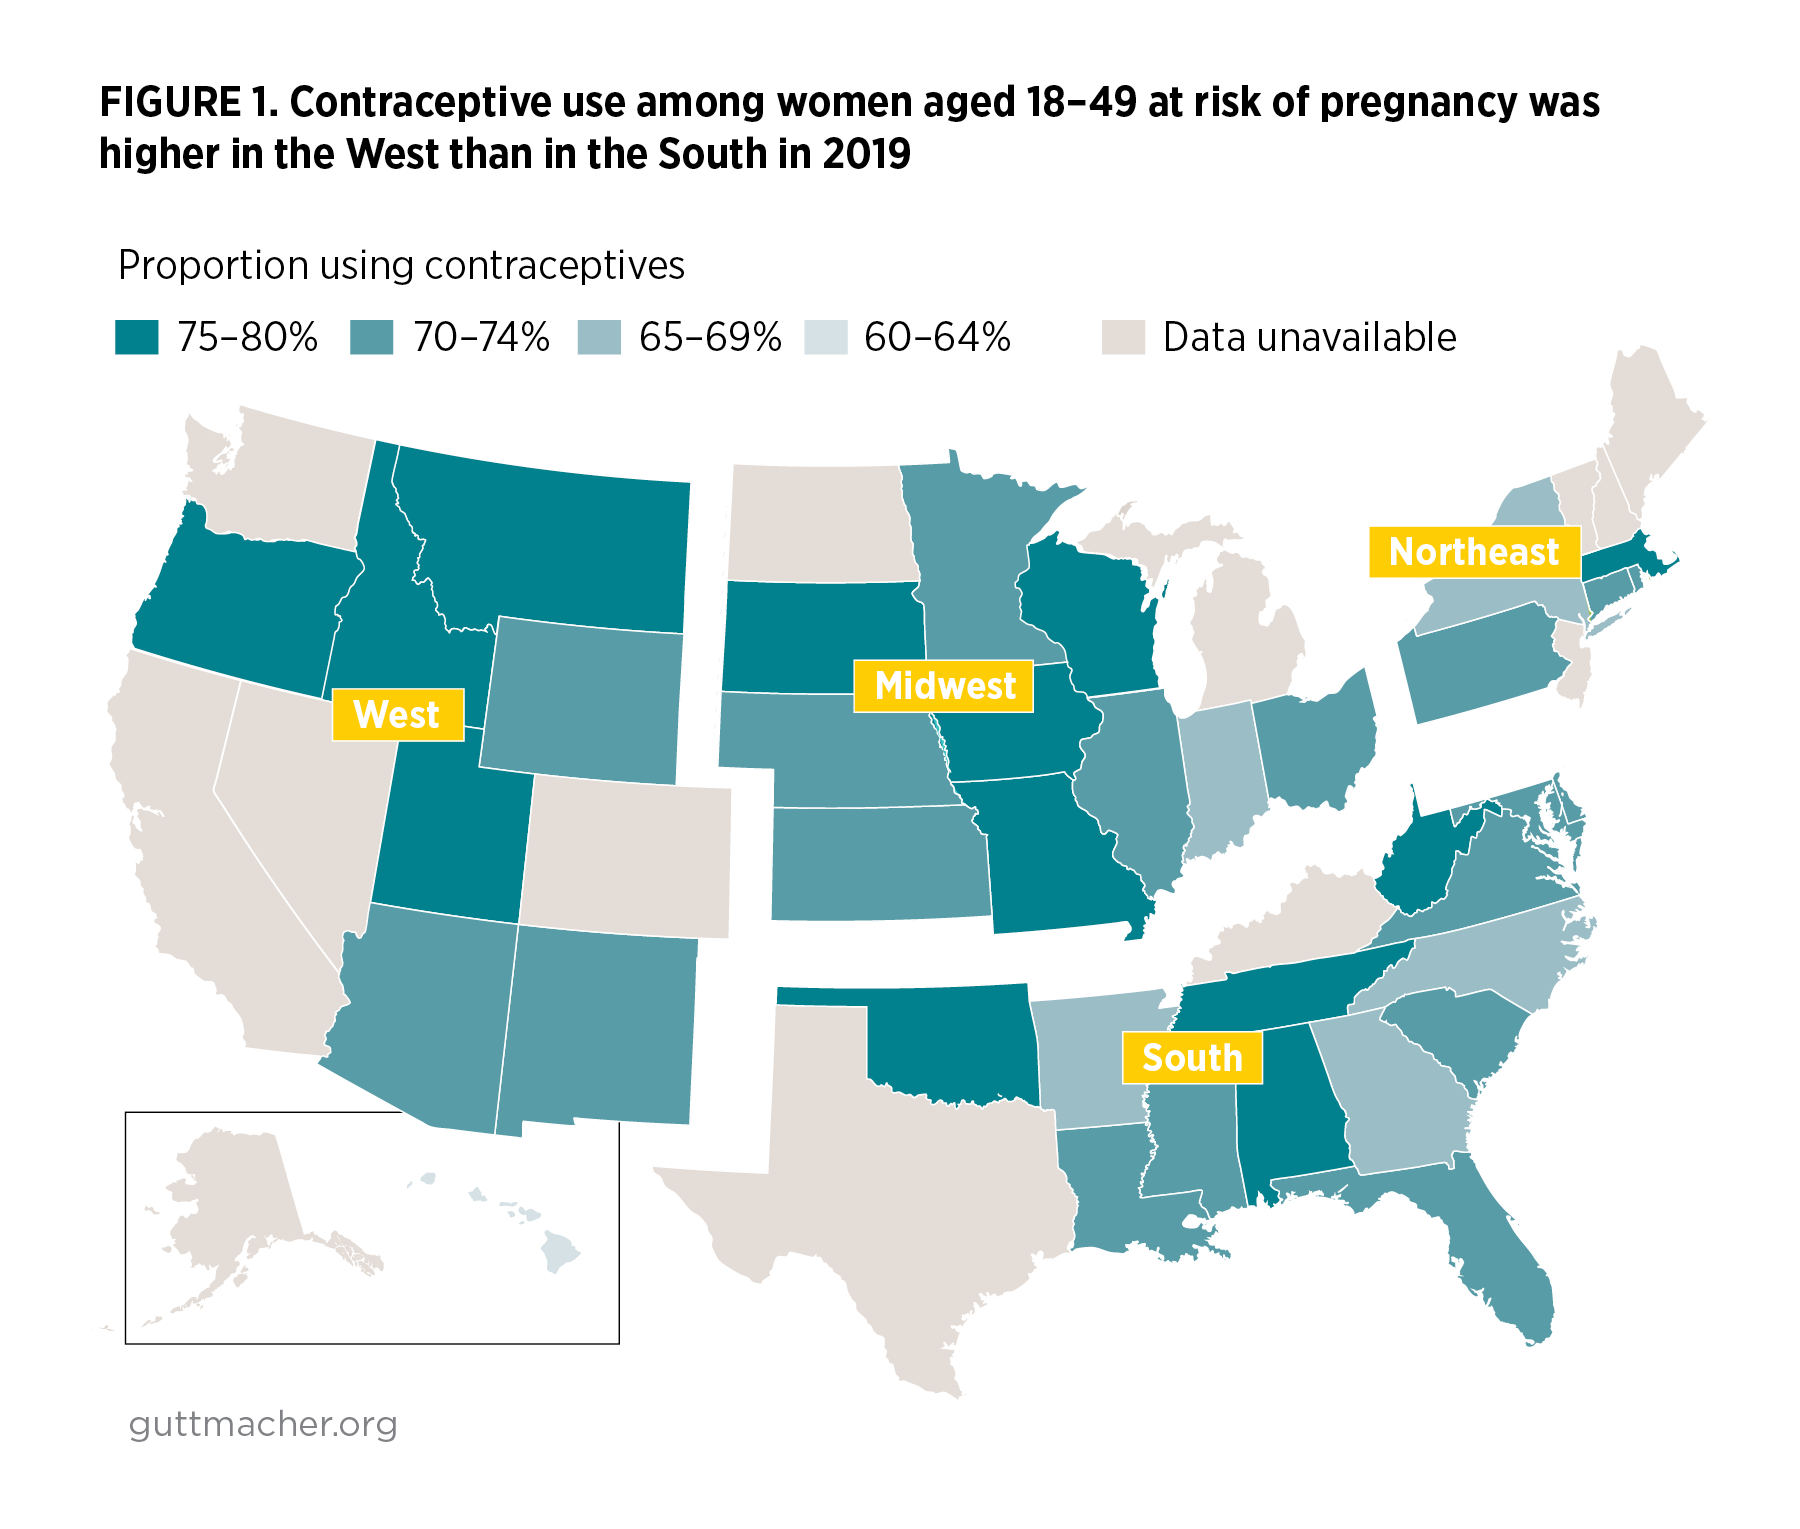
- In 2019, women at risk of pregnancy reported rates of contraceptive use that ranged from 60% in Hawaii to 80% in Oregon.
- Across the 37 states with available BRFSS data for 2019, use of contraceptive methods among women at risk of pregnancy was higher in the West than in the South (Figure 1). No other regional differences were found.
- The proportion of women at risk of pregnancy who reported use of highly effective permanent methods in each state in 2019 ranged from 7% in New York to 29% in West Virginia (Table 2), driven largely by the use of female sterilization (5% in New York to 21% in West Virginia; Table 3).
- The proportion of women at risk of pregnancy who reported use of highly effective LARC methods ranged from 7% in Alabama to 25% in Utah. IUD use was higher than implant use in all states. IUD use ranged from 4% in Alabama to 22% in Utah. Implant use was lowest in Indiana and Tennessee (2%) and highest in New Mexico (4%).
- The proportion of women at risk of pregnancy who reported use of moderately effective methods (i.e., pills, patches, rings and injectables) in 2019 ranged from 12% in New Mexico to 24% in Wisconsin. Birth control pills remain one of the most prevalent primary contraceptive methods used, ranging from 10% in New Mexico to 21% in Rhode Island. In 11 states, birth control pills are the most commonly used method (Delaware, Georgia, Iowa, Minnesota, North Carolina, Ohio, Pennsylvania, Rhode Island, Tennessee, Virginia and Wisconsin).
- Across states, at least one-third of women at risk of pregnancy used a highly effective or moderately effective method. Combined, these methods were used by between 33% and 61% of women at risk of pregnancy (in New York and Utah, respectively).
- The proportion of women at risk of pregnancy who reported use of one of the least effective methods as their primary contraceptive, including condoms and withdrawal, ranged from 15% in Idaho, Montana and Utah to 27% in New York.
- Condoms were the most popular form of primary birth control in 19 states in 2019. The proportion of women at risk of pregnancy who used condoms as their primary method ranged from 12% in Ohio and Idaho to 25% in Illinois.
- Nonuse of contraception among women at risk of pregnancy ranged from 20% in Oregon to 40% in Hawaii. In 35 states, nonuse was more common than use of any single method.
Conclusion
Policies and programs aimed at addressing disparities in sexual and reproductive health outcomes are often designed and implemented at the state level; thus, having state-level data available to illuminate progress toward such goals over time is critical. As the future of federal policies and programs protective of contraceptive access (including the Affordable Care Act and the Title X national family planning program) becomes increasingly uncertain, state-level policies on access to contraceptives may play an increasingly important role in the extent to which individuals are able to realize their contraceptive preferences.7,8 This report highlights wide variation in women’s contraceptive use at the state level as of 2019 and, given the uncertainty noted above, we encourage further research to investigate differences in state-level contraceptive use by individual and context-related characteristics with these and future BRFSS data.
Additional Notes on Data
- Definition of the population of interest. In the previous contraceptive use report using 2017 BRFSS data, our analytic sample included women aged 18–49 who were at risk of unintended pregnancy. Women were included if they reported that they were sexually active with one or more male partners, were not currently pregnant, postpartum or trying to become pregnant, and had not had a hysterectomy. This report analyzes a slightly broader sample of women aged 18–49: those who are at risk of pregnancy. We did not exclude respondents in the BRFSS who indicated that they were trying to become pregnant as a response to why they were not using a contraceptive method. Given evidence that the relationship between pregnancy desires and contraceptive behaviors is sometimes discordant, and that ambivalent or indifferent attitudes toward becoming pregnant and desires to avoid pregnancy are not mutually exclusive categories,9–11 we moved away from including intention status in our determination of eligibility and the population examined in this report focuses more on physical "risk" of pregnancy. The 2017 data presented in this report have been recalculated to apply the same criterion in determining our sample of women at risk of pregnancy.
- Gender identity. All respondents were asked at the time of the interview to identify their sex as male or female in the Demographic section of the core questionnaire. Individuals self-identifying as female are included in our sample of respondents aged 18–49 who reported having been sexually active with one or more male partners. Of note, sex assigned at birth was asked of individuals in seven jurisdictions that fielded Module 28: Sex at Birth. Only five jurisdictions implemented both the Family Planning and the Sex at Birth modules. Gender identity was asked of individuals in 31 jurisdictions that fielded Module 29: Sexual Orientation and Gender Identity (SOGI). In the 25 jurisdictions that implemented both the Family Planning and the SOGI modules, approximately 2% of individuals who identified as female in the core questionnaire either identified as male to female transgender or as gender nonconforming, stated they were unsure, or declined to answer whether they considered themselves to be transgender. These individuals are included in our study sample.
- Questionnaire details. The BRFSS questionnaire consists of three components: a core set of questions used by all jurisdictions that covers demographics, current health conditions and health-related behaviors; optional modules on specific health topics (e.g., sexual and reproductive health, cardiovascular disease, arthritis); and questions that jurisdictions have developed for their own use. The questions from the core and optional modules are edited and evaluated by the CDC; questions added by individual jurisdictions are not.12 Data for this analysis draw from questions in both the core survey and the optional Family Planning module.
Responses to the question about the primary method used to prevent pregnancy were open-ended and grouped in the coding processes. Responses to the question about the nonuse of contraceptives were similarly open-ended. The specific questions and the coding scheme interviewers used to group respondent answers are listed as an appendix. More detailed information on questionnaires, survey methodology, sample design, response rates, fieldwork procedures and variance estimation is published elsewhere.13,14
- Reliability standards. We used reliability standards established for BRFSS by the CDC (i.e., relative standard error greater than 30% or an unweighted denominator of fewer than 50 respondents).15 Estimates for certain methods did not meet the criteria for reliability in some jurisdictions and were therefore further grouped with other methods in their respective contraceptive effectiveness classifications: injectables, patches and rings were grouped together under "other non-LARC hormonal" to distinguish them from oral contraceptive pills; emergency contraception, diaphragms, cervical sponges, cervical caps, rhythm method and natural family planning methods were grouped together under "other."
Limitations
- BFRSS response rates are low in many states. The median combined (landline and cell phone) response rate for all 2017 BRFSS samples was 46%, with rates ranging from 31% in Illinois to 64% in Wyoming.16 The median combined response rate for all 2019 BRFSS samples was 50%, with rates ranging from 37% in New York to 73% in South Dakota.17
- Concurrent use of multiple contraceptive methods cannot be ascertained with these data. There is a growing body of literature that indicates some individuals employ contraceptive strategies that are more complex than using a single method at each coital act, and several studies suggest that less effective methods are more commonly used than was previously detected.18–22 Therefore, BRFSS data underestimate the use of some less effective methods, such as condoms and withdrawal, that are often employed concurrently by dual method users. The BRFSS uses an open-ended question to determine the method respondents used at last sex; responses are probed only if clarification is necessary (e.g., to determine whether an IUD user uses a hormonal or nonhormonal IUD). Studies have shown that many women in the United States underreport their use of least effective methods when not prompted with an exhaustive list of options.23
- The BRFSS also uses an open-ended question to determine reasons for not using a contraceptive method at last sex, and responses are probed only if deemed necessary. BRFSS respondents who had had a hysterectomy could only be identified if they cited this as a reason for not using a birth control method the last time they had sex. Respondents reporting having had a hysterectomy in this question were excluded from the denominator of women at risk of pregnancy. Similarly, women were identified as postpartum using this question. By not fully identifying the population of women aged 18–49 who had had a hysterectomy or were postpartum, we may have inflated the number of women at risk of pregnancy by including them in this group. Inflating the number of women at risk may, in turn, have resulted in an underestimate of the proportion of contraceptive users among women at risk of pregnancy.
- Questions in the 2017 and 2019 BRFSS on current use of birth control focus on "the last time" respondents had sex: "Did you or your partner do anything the last time you had sex to keep you from getting pregnant?" The timeframe of respondents’ last sexual encounter is ambiguous, and some recall bias may have been introduced as a result of not defining concrete limits (such as the last three months or the last year).
- Information on contraceptive use was self-reported and may be subject to recall or social desirability biases. Nonresponse bias is likely minimized in these data, as the weighting methodology used by BRFSS adjusts for this possibility.
- Thirteen states did not field the BRFSS Family Planning module in 2019: Alaska, California, Colorado, Kentucky, Maine, Michigan, New Hampshire, New Jersey, Nevada, North Dakota, Texas, Vermont and Washington. Unavailability of data may have affected our regional analysis.
FOOTNOTES
*AL, AK, AZ, CA, CT, DE, DC, FL, GA, HI, ID, IN, IA, KS, LA, ME, MD, MA, MN, MS, MO, NE, NV, NJ, NM, NY, NC, OH, OK, OR, PA, PR, SC, SD, TX, UT, VA, WV, WI and WY.
†AL, AZ, AR, CT, DE, FL, GA, HI, ID, IL, IN, IA, KS, LA, MD, MA, MN, MS, MO, MT, NE, NM, NY, NC, OH, OK, OR, PA, PR, RI, SC, SD, TN, UT, VA, WV, WI and WY.
‡Multiple method use is not documented in the BRFSS. Because the use of more than one method was not recorded, use of less effective contraceptive methods is underestimated.
§Highly effective permanent methods: female sterilization or male sterilization, as reported by respondent. Highly effective LARC methods: IUDs and contraceptive implants. Moderately effective methods: injectables, pills, patches and vaginal rings. Least effective methods: male and female condoms, diaphragm, cervical cap, sponge, rhythm method, natural family planning, withdrawal, spermicidal foam/jelly/film/cream and emergency contraception.
Appendix
BRFSS survey questions relevant to this analysis
Appendix Table 1
REFERENCES
1. Daniels K and Mosher WD, Contraceptive methods women have ever used: United States, 1982–2010, National Health Statistics Reports, 2013, No. 62.
2. Douglas-Hall A, Kost K and Kavanaugh ML, State-Level Estimates of Contraceptive Use in the United States, 2017, New York: Guttmacher Institute, 2018, https://www.guttmacher.org/report/state-level-estimates-contraceptive-u….
3. Centers for Disease Control and Prevention (CDC), BRFSS Annual Survey Data, 2019, https://www.cdc.gov/brfss/annual_data/annual_data.htm.
4. Pazol K et al., Contraceptive use among women at risk for unintended pregnancy in the context of public health emergencies—United States, 2016, Morbidity and Mortality Weekly Report, 2018, Vol. 67, No. 32.
5. Trussell J et al., Efficacy, safety, and personal considerations, in: Hatcher R et al., eds., Contraceptive Technology, 21st ed., New York: Managing Contraception, 2018, pp. 95–128.
6. U.S. Department of Health and Human Services (HHS), Effectiveness of family planning methods, 2011.
7. Guttmacher Institute, Insurance coverage of contraceptives, State Laws and Policies (as of Dec. 2020), 2020, https://www.guttmacher.org/state-policy/explore/insurance-coverage-cont….
8. Sonfield A, Seeing the whole pattern: coordinated federal attacks on birth control coverage and access, Guttmacher Institute, 2020, https://www.guttmacher.org/article/2020/06/seeing-whole-pattern-coordin….
9. Aiken ARA et al., Rethinking the pregnancy planning paradigm: unintended conceptions or unrepresentative concepts?, Perspectives on Sexual and Reproductive Health, 2016, 48(3):147–151, doi:10.1363/48e10316.
10. Miller WB, Barber JS and Gatny HH, The effects of ambivalent fertility desires on pregnancy risk in young women in the USA, Population Studies, 2013, 67(1):25–38, doi:10.1080/00324728.2012.738823.
11. Yoo SH, Guzzo KB and Hayford SR, Understanding the complexity of ambivalence toward pregnancy: Does it predict inconsistent use of contraception?, Biodemography and Social Biology, 2014, 60(1):49–66, doi:10.1080/19485565.2014.905193.
12. Office of Disease Prevention and Health Promotion, HHS, Behavioral Risk Factor Surveillance System, no date, https://www.healthypeople.gov/2020/data-source/behavioral-risk-factor-s….
13. CDC, The BRFSS Data User Guide, 2013, https://www.cdc.gov/brfss/data_documentation/pdf/UserguideJune2013.pdf.
14. CDC, Behavioral Risk Factor Surveillance System: Overview, BRFSS 2019, 2019, https://www.cdc.gov/brfss/annual_data/2019/pdf/overview-2019-508.pdf.
15. CDC, Behavioral Risk Factor Surveillance System: Comparability of Data BRFSS 2016, 2017, https://www.cdc.gov/brfss/annual_data/2016/pdf/compare_2016.pdf.
16. CDC, Behavioral Risk Factor Surveillance System: 2017 Summary Data Quality Report, Table 6. Response Rates for Landline and Cell Phone Samples, 2018, https://www.cdc.gov/brfss/annual_data/2017/pdf/2017-sdqr-508.pdf.
17. CDC, Behavioral Risk Factor Surveillance System: 2019 Summary Data Quality Report, Table 6. Response Rates for Landline and Cell Phone Samples, 2020, https://www.cdc.gov/brfss/annual_data/2019/pdf/2019-sdqr-508.pdf.
18. Frost JJ, Singh S and Finer LB, U.S. women’s one-year contraceptive use patterns, 2004, Perspectives on Sexual and Reproductive Health, 2007, 39(1):48–55, doi:10.1363/3904807.
19. Jones RK, Lindberg LD and Higgins JA, Pull and pray or extra protection? Contraceptive strategies involving withdrawal among US adult women, Contraception, 2014, 90(4):416–421, doi:10.1016/j.contraception.2014.04.016.
20. Frohwirth L et al., The complexity of multiple contraceptive method use and the anxiety that informs it: implications for theory and practice, Archives of Sexual Behavior, 2016, 45(8):2123–2135, doi:10.1007/s10508-016-0706-6.
21. Brown JL et al., Multiple method contraception use among African American adolescents in four US cities, Infectious Diseases in Obstetrics and Gynecology, 2011, doi:10.1155/2011/765917.
22. Whittaker PG et al., Withdrawal attitudes and experiences: a qualitative perspective among young urban adults, Perspectives on Sexual and Reproductive Health, 2010, 42(2):102–109, doi:10.1363/4210210.
23. Jones J, Mosher W and Daniels K, Current contraceptive use in the United States, 2006–2010, and changes in patterns of use since 1995, National Health Statistics Reports, 2012, Vol. 18, No. 60.