This report presents new state-level estimates of sexual activity and contraceptive use among high school students in the United States. The data are from the 2019 Youth Risk Behavior Surveillance System (YRBSS), which is managed by the U.S. Centers for Disease Control and Prevention (CDC). Because the 2019 YRBSS included more states than in prior years, we are able to better identify differences across states and regions, as well as describe recent trends. In particular, we examine variations in adolescents’ sexual activity and their use of condoms and of other contraceptive methods, because of their important implications for exposure to STIs and pregnancy.* The YRBSS offers a unique opportunity to examine sexual and reproductive health at the state level among high school students.
Data and Methods
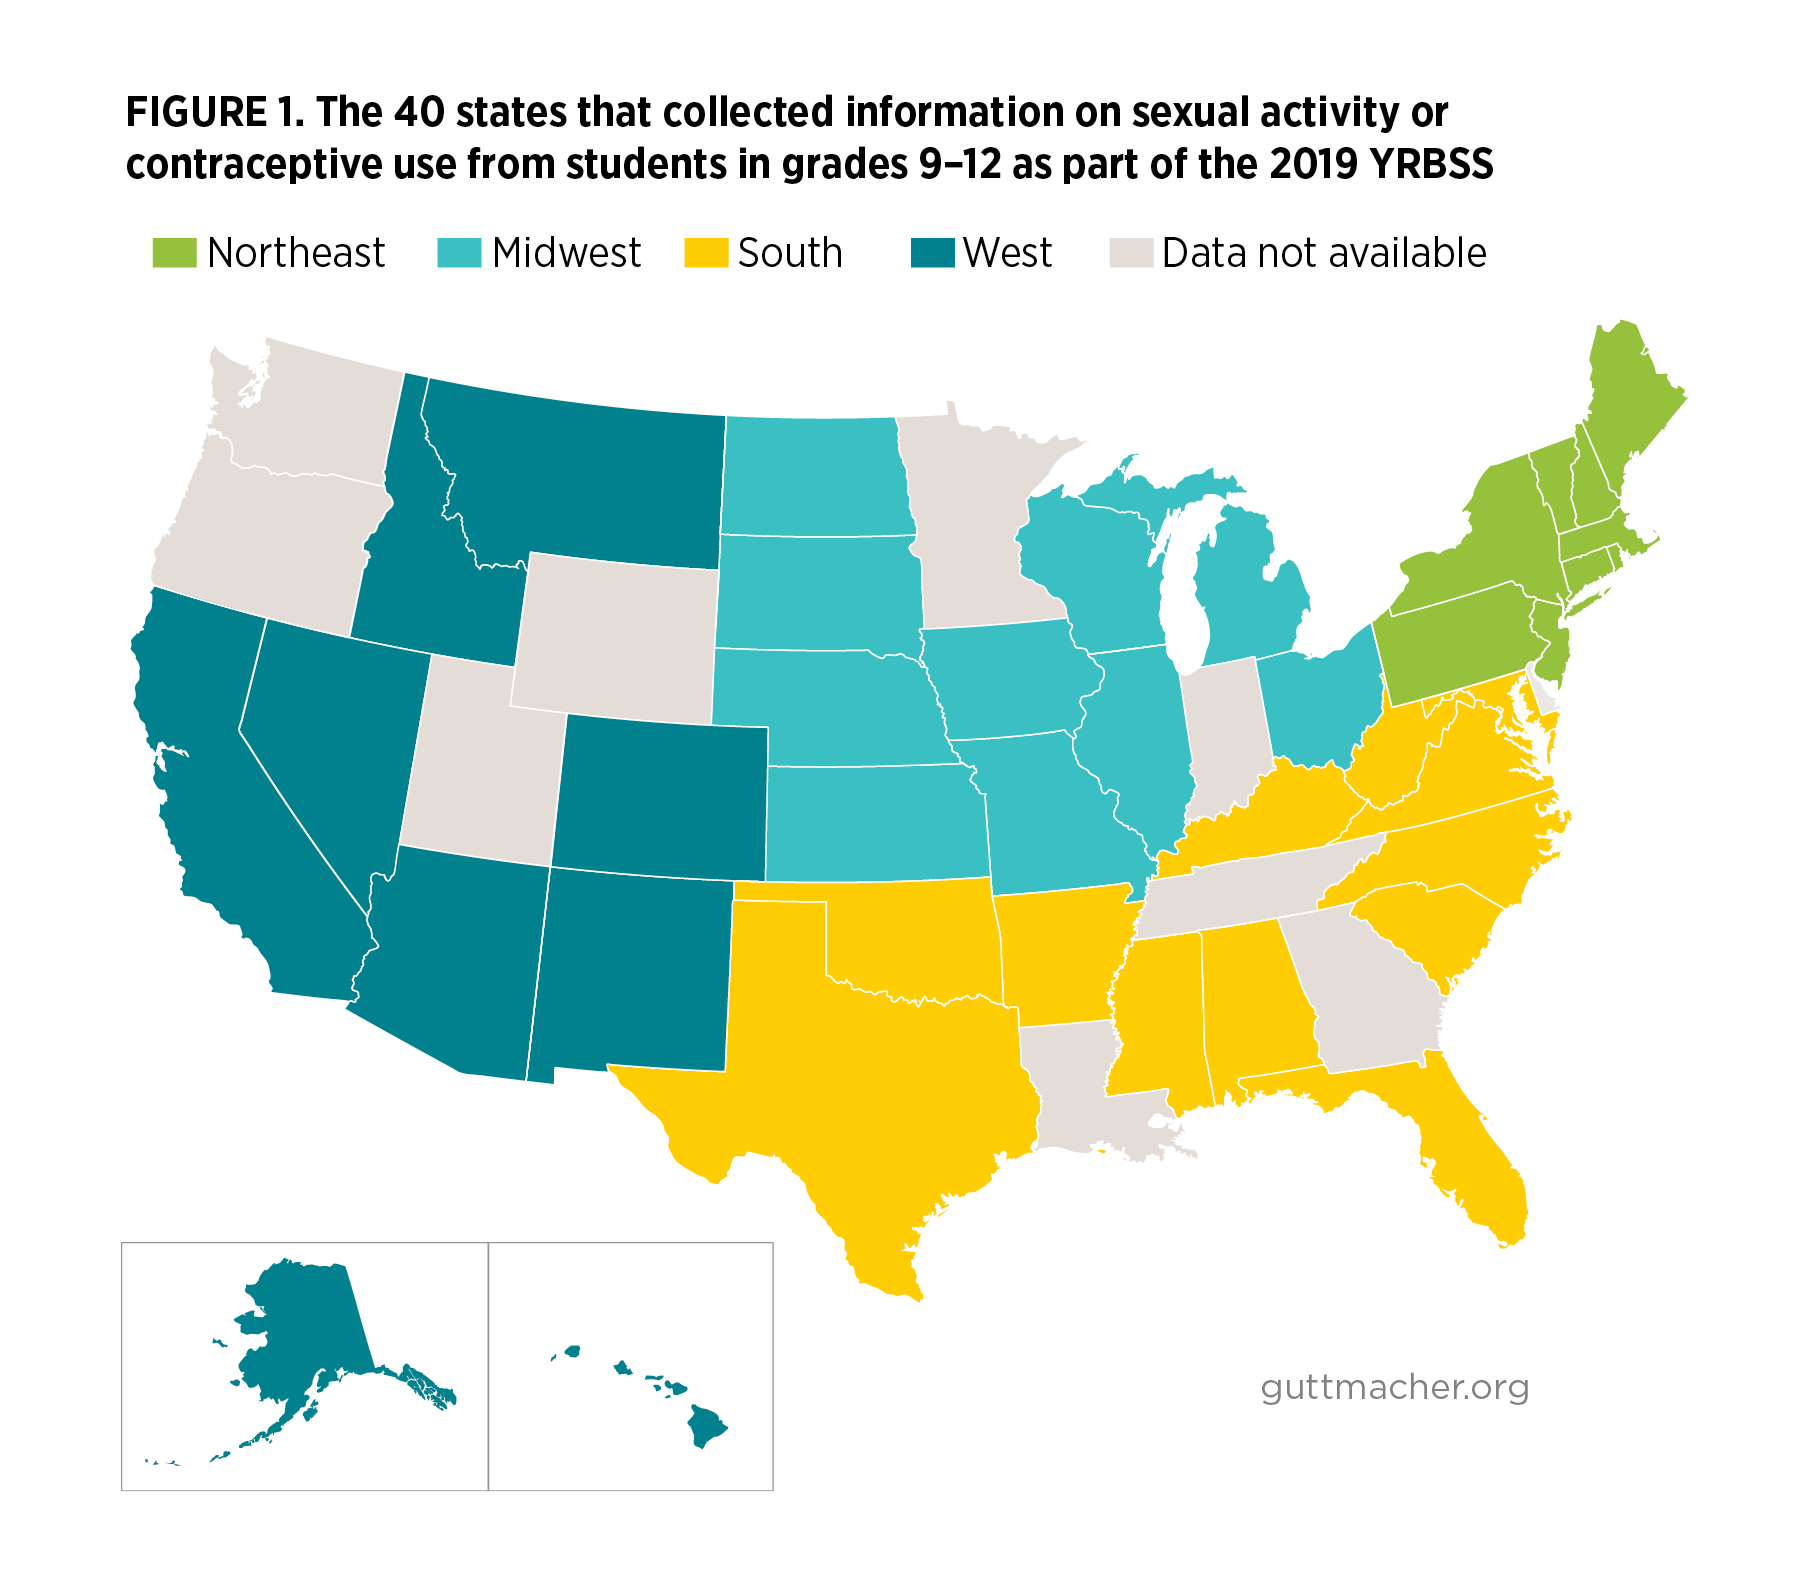
The YRBSS conducts biannual school-based surveys among U.S. students in grades 9–12. We examine 2019 data from approximately 130,000 students from the 40 states that collected information on sexual activity or contraceptive use (Figure 1). We contrast the 2019 state estimates with data from the separate national Youth Risk Behavior Survey (YRBS)1 and examine changes between 2015 and 2019 both nationally and among states; we focus on differences that are statistically significant at p<.05. Additional information about the surveys, methods of analysis and limitations is provided in Appendix 1.
Highlighted Findings
State variations in sexual experience
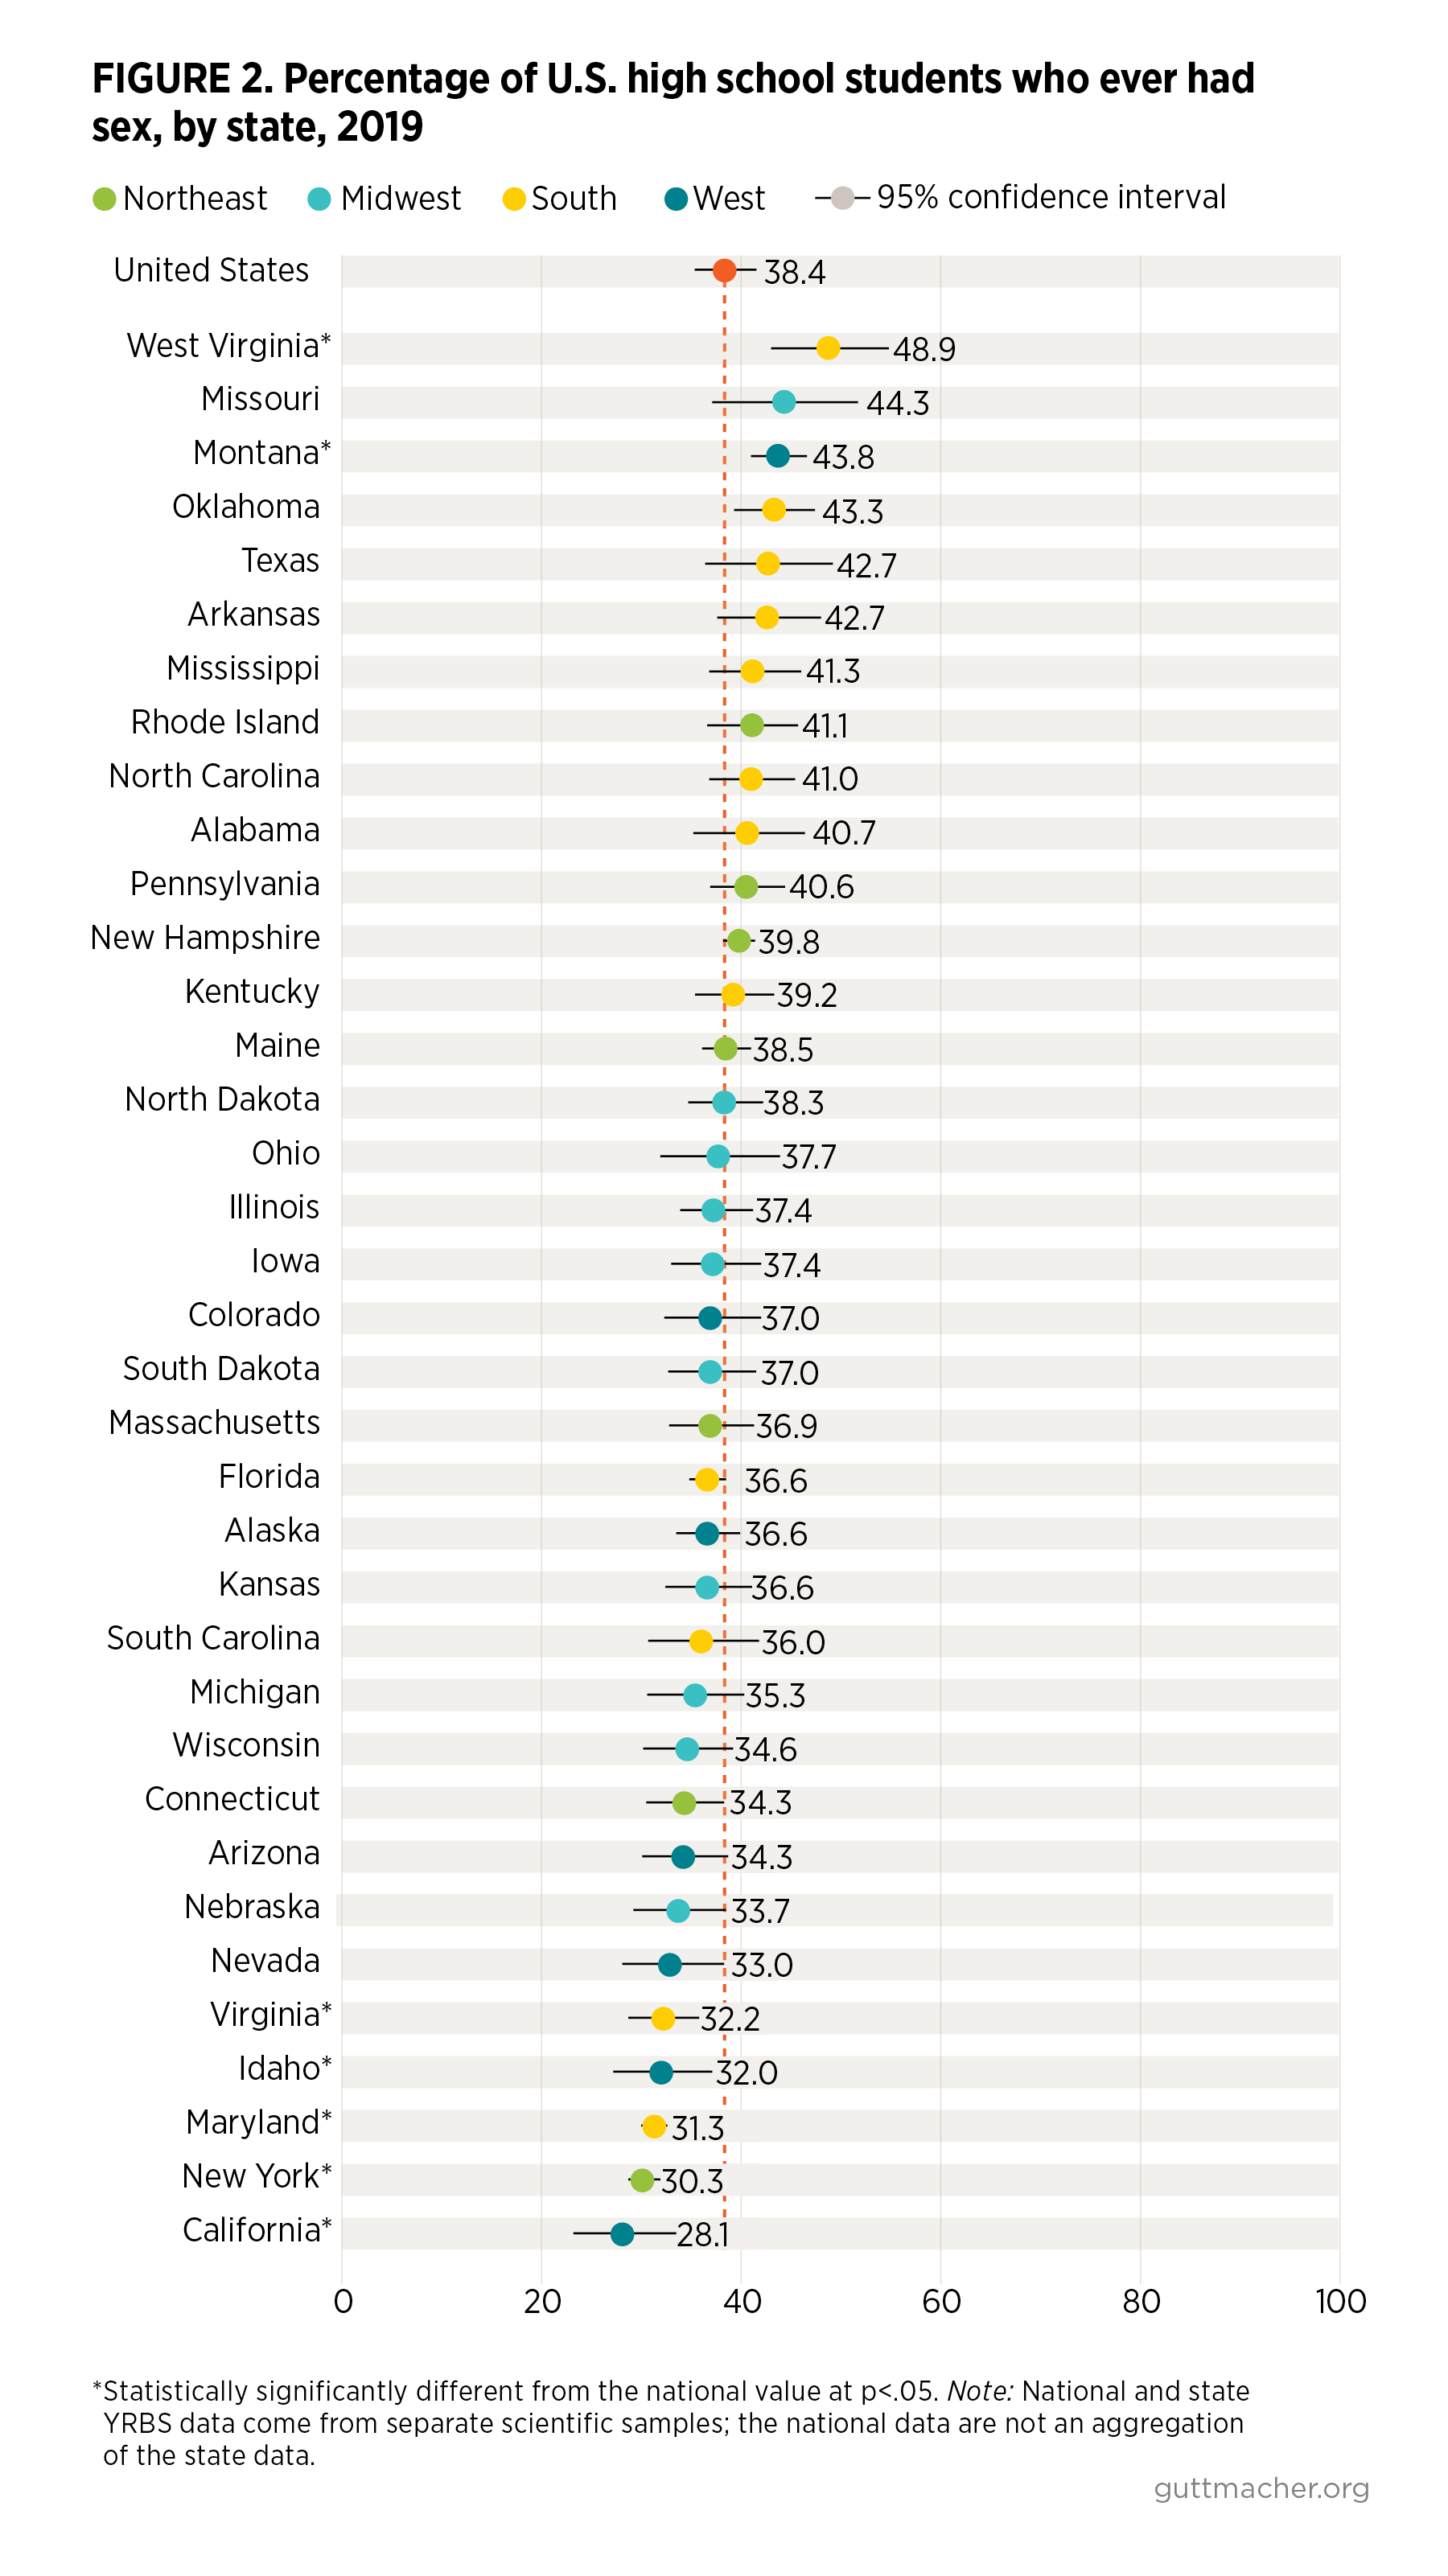
- Nationally, 38% of students report having had sex (Figure 2).†
- The proportion of students who have ever had sex varies across states, from 28% in California to 49% in West Virginia.
- Seven of the 10 states with the highest proportion of sexually experienced students are in the South.
- Compared with the national rate, the proportion of students who have ever had sex is higher in West Virginia (49%) and Montana (44%) and is lower in California (28%), New York (30%), Maryland (31%), Idaho (32%) and Virginia (32%).
- Nationally, the proportion of sexually experienced students increases by grade, from 19% among ninth-graders to 34% among 10th-graders, 47% among 11th-graders and 57% among 12th-graders, with similar patterns in every state (not shown).
- In general, the proportion of students who have ever had sex does not vary by gender (not shown).
State variation in condom use at last sex
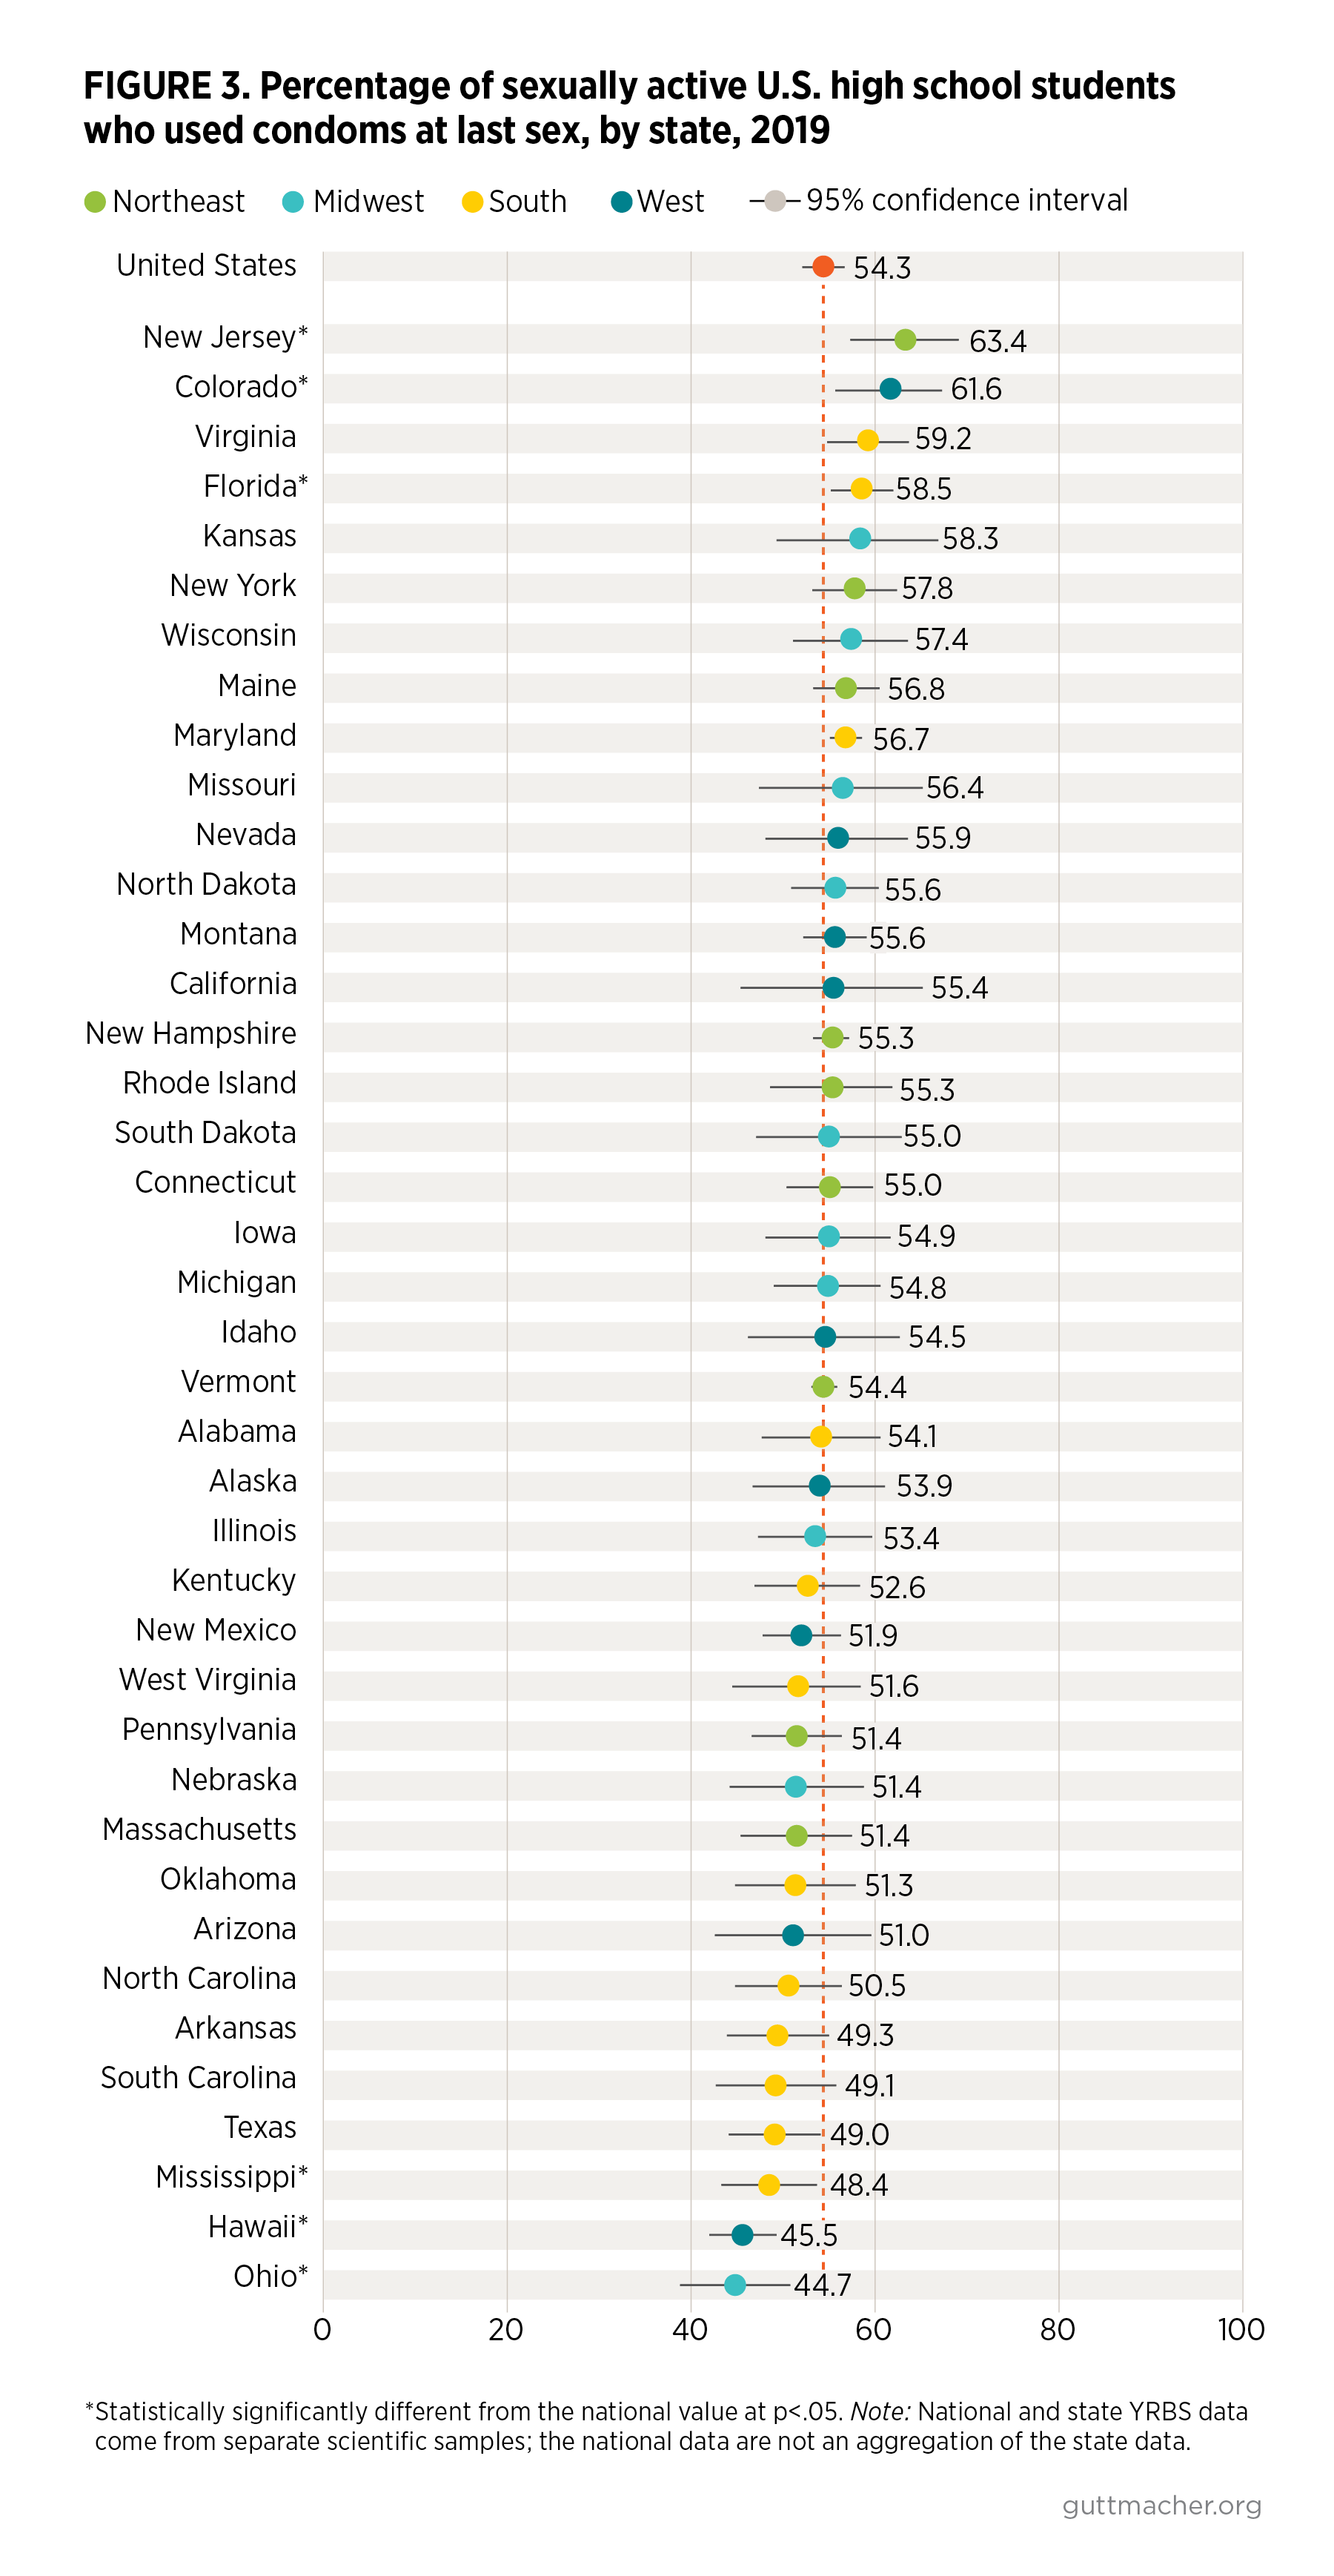
- Nationally, 54% of sexually active high school students report having used condoms at last sex (Figure 3).‡
- Condom use at last sex ranges from a low of 45% in Ohio to a high of 63% in New Jersey.
- Six of the 10 states with the lowest condom use rates are in the South.
- The proportion of high school students using condoms is higher than the national rate in New Jersey (63%), Colorado (62%) and Florida (59%) and is lower in Ohio (45%), Hawaii (46%), and Mississippi (48%).
State variation in prescription contraceptive use at last sex
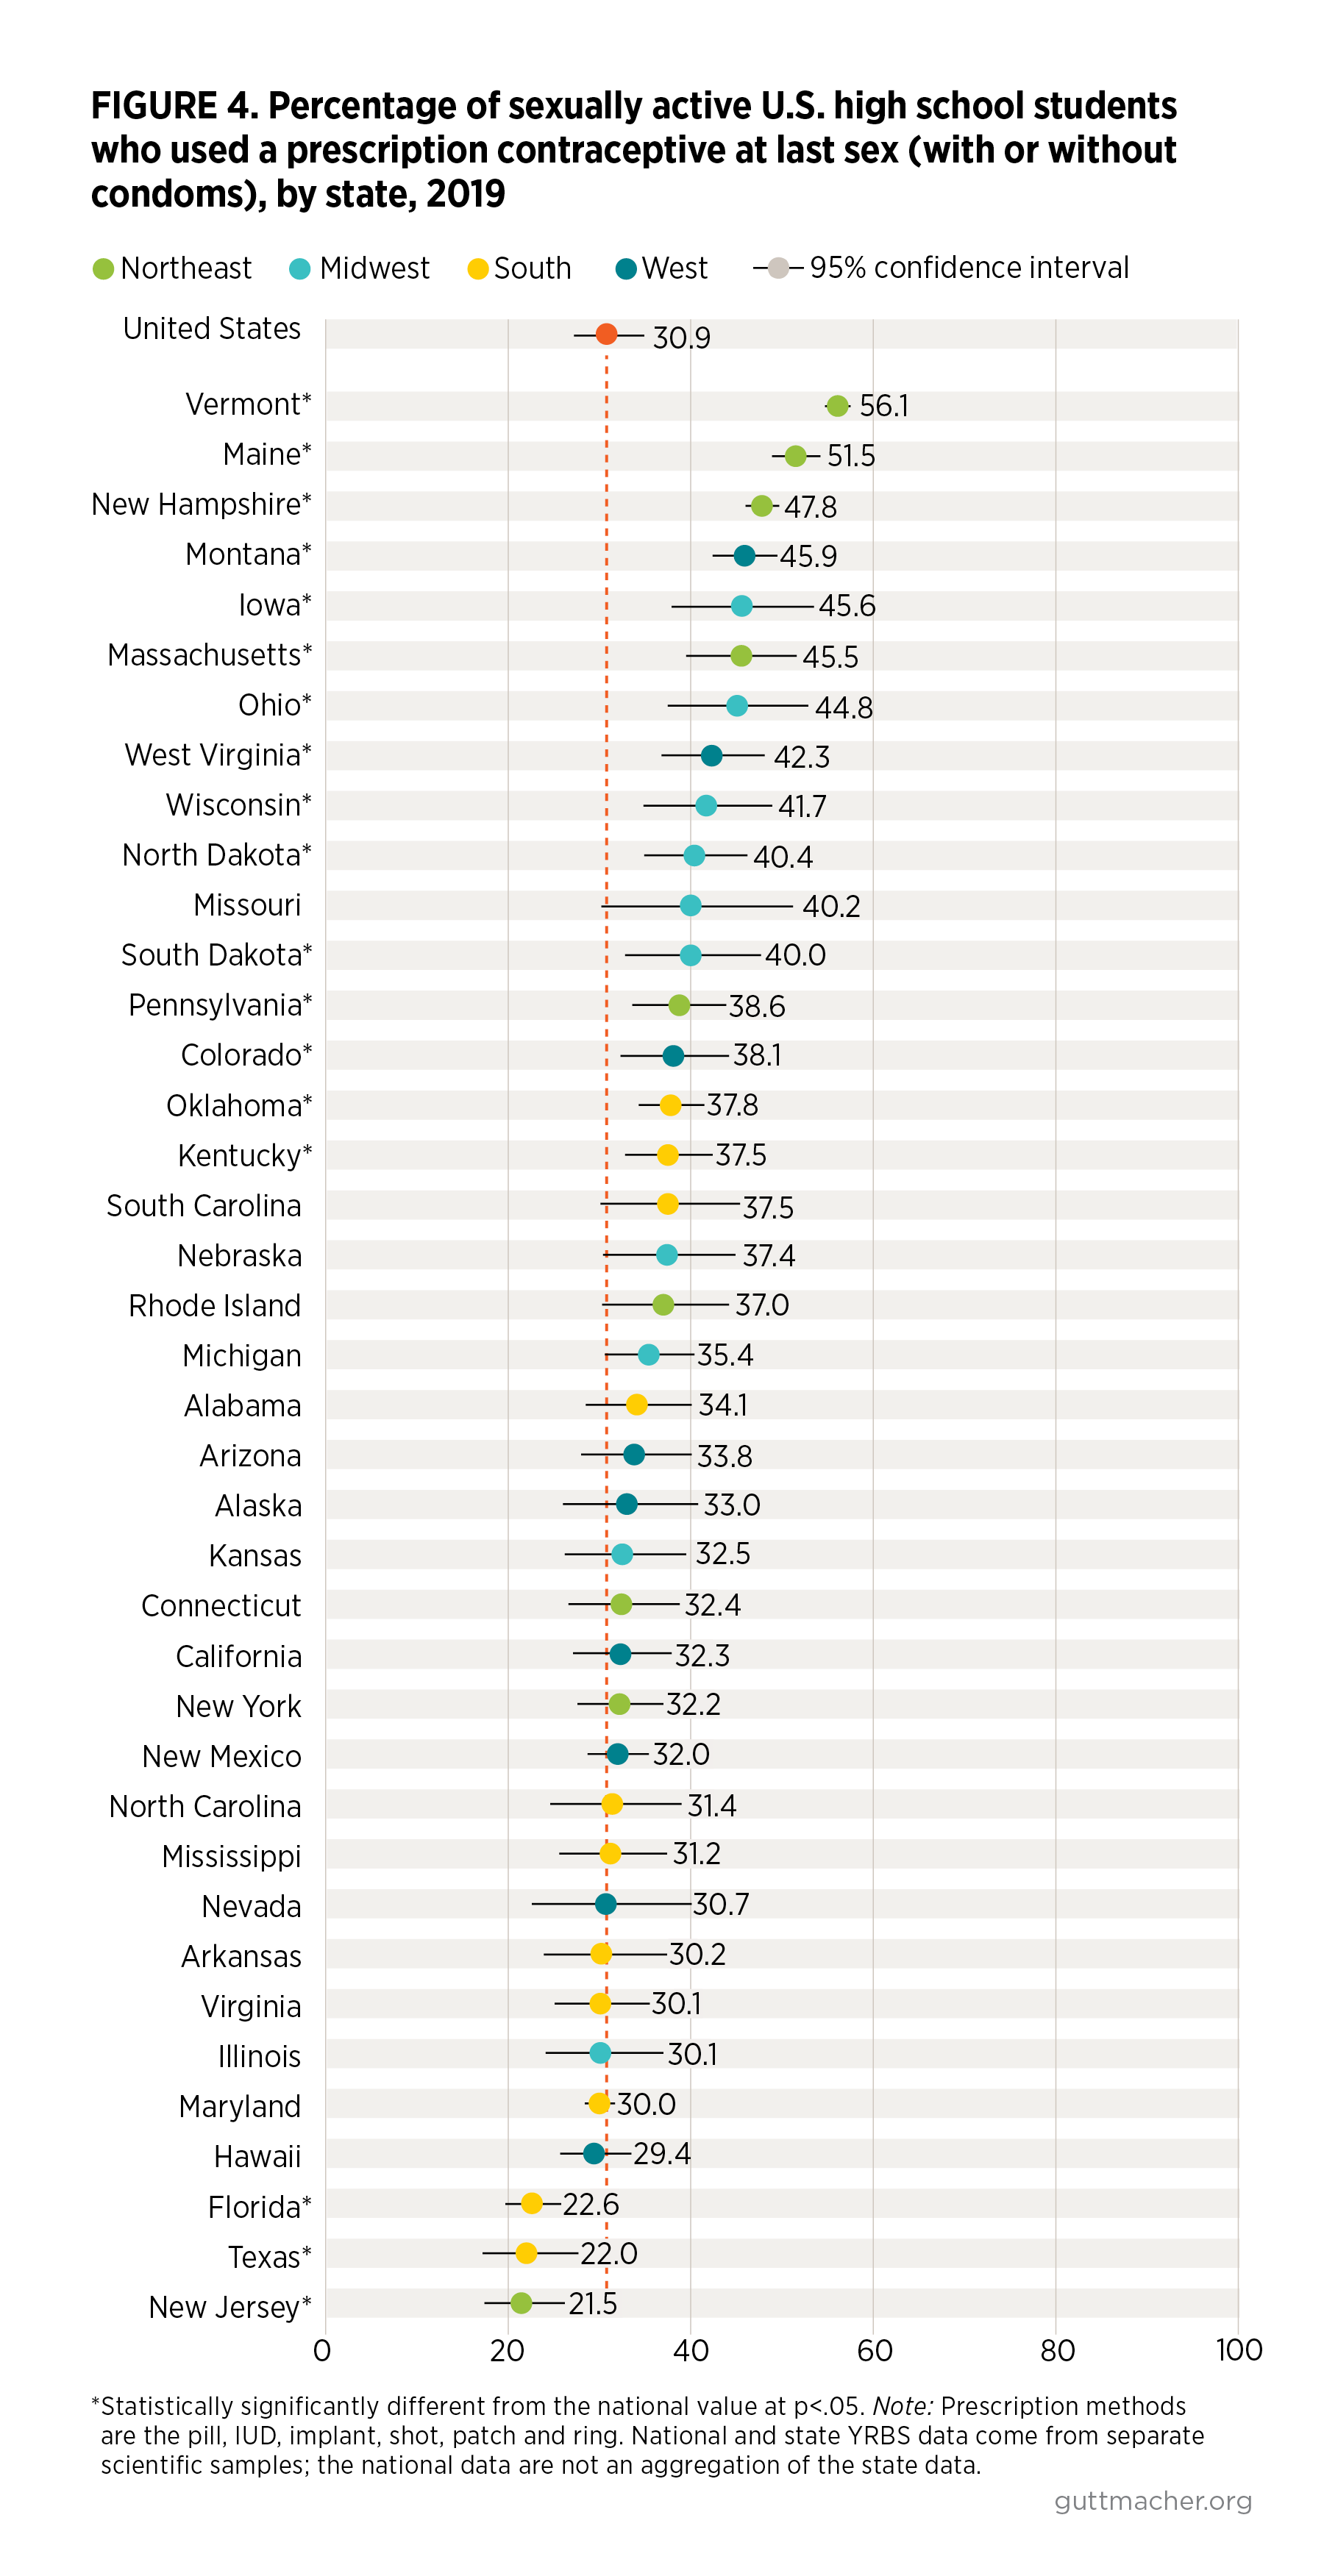
- Nationally, 31% of sexually active students report using a prescription contraceptive method (i.e., the pill, IUD, implant, shot, patch or ring), either alone or with a condom, at last sex (Figure 4).
- Use of a prescription method ranges from a low of 22% in New Jersey to a high of 56% in Vermont.
- The 35-percentage-point range across states in the use of prescription methods exceeds the range observed for condom use or sexual experience.
- Six of the 10 states with the lowest proportion of students using prescription methods are in the South.
- In 15 states, the prevalence of prescription method use is higher than in the United States overall: Vermont (56%), Maine (52%), New Hampshire (48%), Montana (46%), Iowa (46%), Massachusetts (46%), Ohio (45%), West Virginia (42%), Wisconsin (42%), North Dakota (40%), South Dakota (40%), Pennsylvania (39%), Colorado (38%), Oklahoma (38%) and Kentucky (37%). Only students in New Jersey (21%), Texas (22%), and Florida (23%) report rates that are lower than the national rate.
State variation in overall contraceptive use
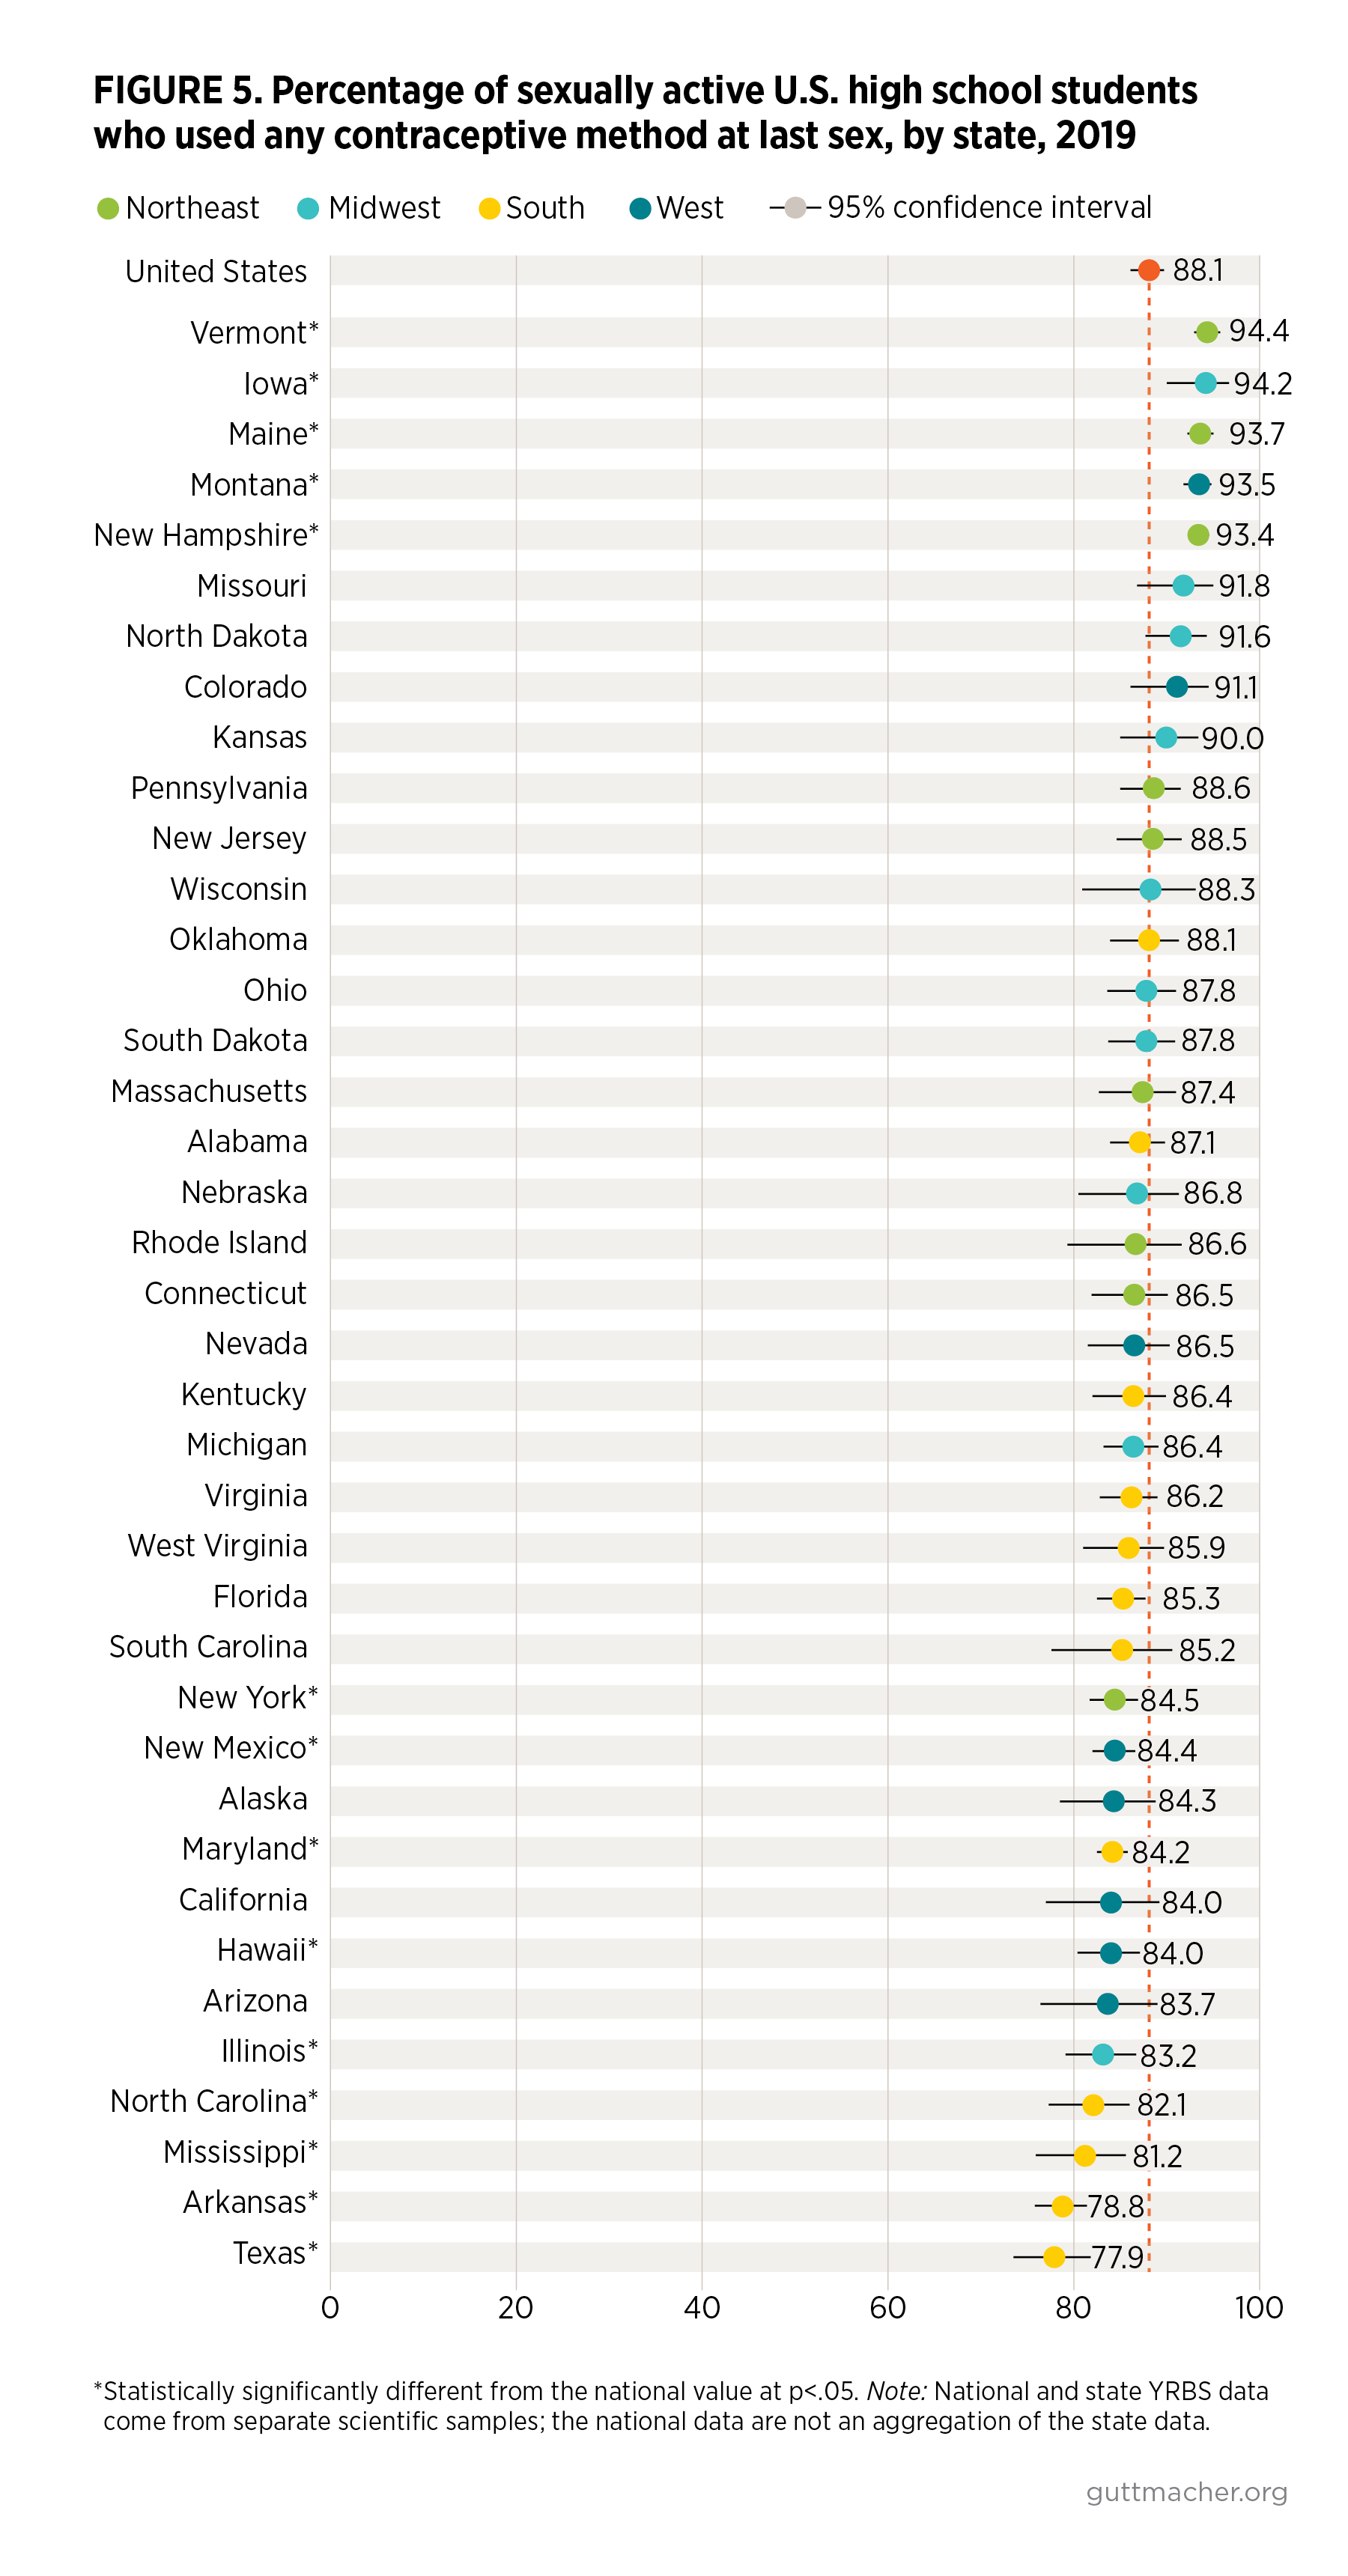
- Nationally, 88% of students report using any contraceptive method at last sex (Figure 5).§
- Overall, contraceptive use at last sex ranges from a low of 78% (Texas) to a high of 94% (Vermont).
- Five of the 10 states with the lowest proportion of students using contraception at last sex are in the South and four are in the West.
- No Southern state is among the 10 states with the highest contraceptive use at last sex.
- Overall method use is higher than the national average in only five states: Vermont (94%), Iowa (94%), Maine (94%), Montana (93%) and New Hampshire (93%). It is lower than the national average in Texas (78%), Arkansas (79%), Mississippi (81%), North Carolina (82%), Illinois (83%), Hawaii (84%), Maryland (84%), New Mexico (84%) and New York (84%).
Changes in sexual experience and contraceptive use, 2015 to 2019**
- In the United States overall, and in every state except Florida, the proportion of students who ever had sex did not change from 2015 to 2019.
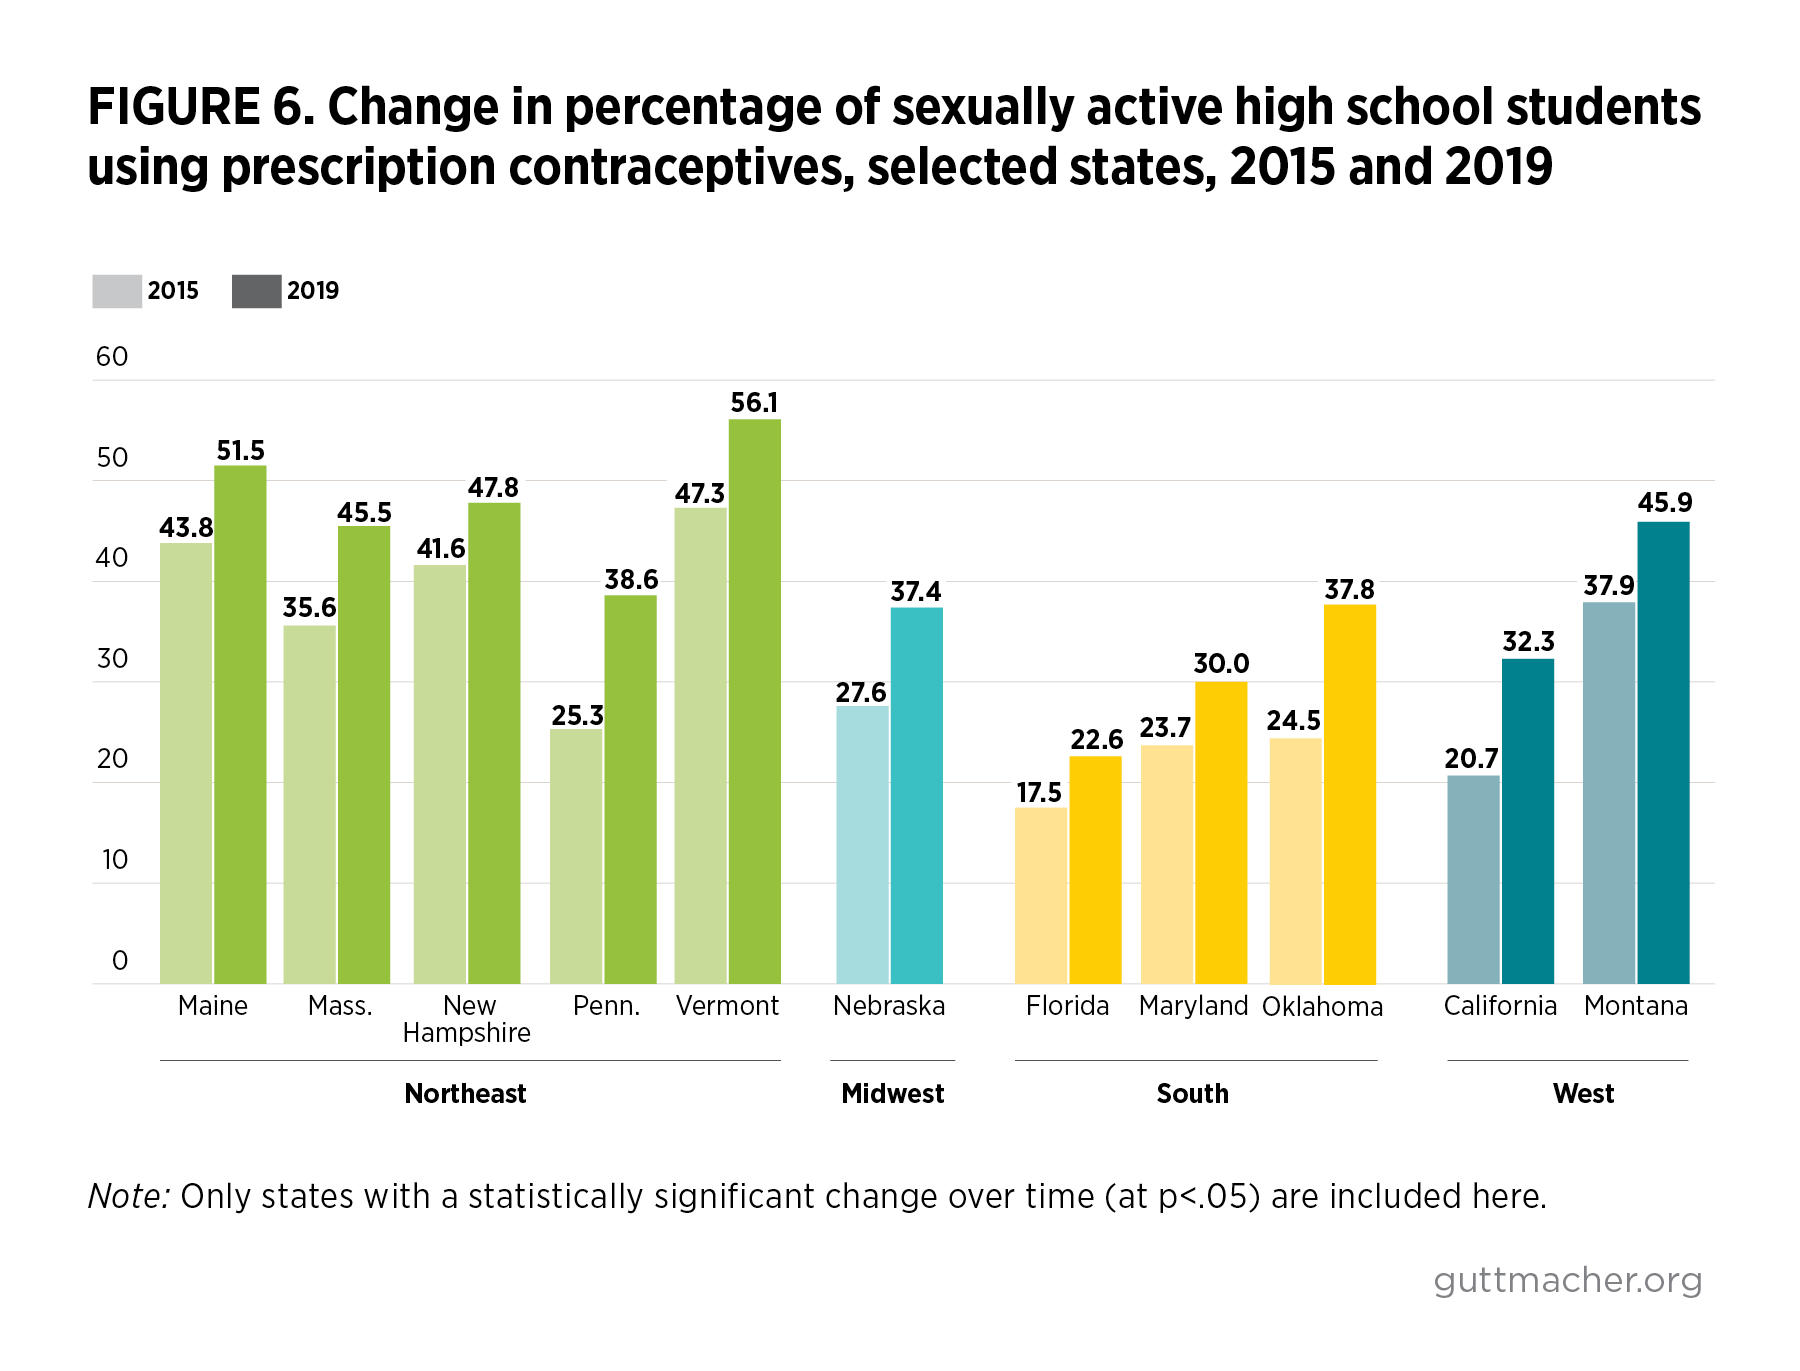
- Nationally, the proportion of students using prescription methods did not change from 2015 to 2019. However, prescription method use rose in 11 states (Figure 6), driven by an increase in IUD and implant use. Five of these states are in the Northeast: Maine, Massachusetts, New Hampshire, Pennsylvania and Vermont.
- There was no national-level change in condom use from 2015 to 2019, but six states showed a decline in condom use (Massachusetts, Pennsylvania, New Hampshire, Maryland, Vermont and North Carolina). In five of these states—all but North Carolina—prescription method use also increased.
- Use of any method remained stable from 2015 to 2019 in nearly all states and in the United States as a whole.
Discussion
Adolescents’ behaviors, including their emerging sexuality and experiences, are shaped by the contexts in which they live.2 The comparisons highlighted in this report point to ongoing needs and opportunities to further support students’ sexual and reproductive health and reduce geographic disparities. This state-level focus is particularly valuable, given that many youth-focused policies and funding streams across a variety of sectors—including schools and health care—operate at the state level. Thus, where young people live can have an important influence on their sexual health and well-being. This report documents four main takeaways:
- Sexual activity continues to be a normal part of adolescent development, regardless of where young people live. The 2019 YRBSS data show that while, nationally, more than one in three high school students report ever having sexual intercourse, this proportion varies across states. Still, in the United States overall and in each state studied, the proportion of high school students who are sexually experienced increases by grade and generally does not vary by gender. The majority of students become sexually active by the time they graduate from high school. These demographic patterns reinforce the reality that all adolescents need information, resources and support for healthy development, no matter when they start having sex.
- The greater variation between states in prescription method use than in condom use suggests that barriers to contraceptive care may influence students’ method choice. While condoms are widely available from nonmedical sources, young people must interact with the health care system to obtain prescription contraceptive methods. State policies affect adolescents’ access to prescription contraceptive methods, and access to affordable, accessible and confidential contraceptive care is not equally available. For example, only 23 states explicitly allow minors to consent to contraceptive care,3 and only six states explicitly protect the confidentiality of individuals insured as dependents.4 Thus, adolescents’ concerns about confidentiality may limit their use of contraceptive services and their ability to obtain prescription methods.5 Yet overall contraceptive use varies little across states; students appear to respond to barriers to prescription method use by relying on condoms and other nonprescription methods, such as withdrawal. Still, no one contraceptive method is best for every adolescent, and decision making about method choice should reflect individuals’ needs and priorities.
- High school students in many Southern states tend to have higher rates of sexual activity and lower rates of contraceptive use than students in other regions of the country. In addition, more Northeastern states have seen increases over time in prescription method use. These regional patterns point to a need for focused attention to improving adolescents’ access to contraception in areas with lower contraceptive use rates and in those without recent improvement.
- Recent patterns suggest that contraceptive use continues to be the main driver of declines in adolescent pregnancies in many states. From 2015 to 2019, the proportion of sexually experienced high school students remained stable in all but one state, yet in many states, use of more effective methods of contraception increased. Taken together, these findings further support the conclusions of earlier studies that improved contraceptive use is the critical driver of declines in U.S. adolescent fertility and pregnancy rates.6–8 However, we caution that the YRBS trends exclude out-of-school adolescents and may not directly track with the trends in pregnancy and births for all adolescents.
Conclusion
Schools offer an important opportunity to intervene in and support students’ healthy sexual development. Although most adolescents report receipt of some school-based sex education, the scope, content and quality of this instruction vary widely.9 Many high schools do not teach about each of the 20 sexual health topics recommended by the CDC (a median of 43% of U.S. high schools do so, ranging from 4% to 87% across states).10 Schools also can be a direct source of sexual and reproductive health care, including by providing condoms and other contraceptives or by referring students to youth-friendly health care providers in the community.11 Expanding access to medically accurate comprehensive sex education, as well as school-based health centers and other sources of reproductive health care, can help to support students’ sexual and reproductive health. Notably, even for young people in school, support for their health and well-being can come from various places and can include community, home, media, and other health system resources and partnerships.12
This report highlights variation in high school students’ sexual experience and contraceptive use across the United States. We encourage further research to investigate differences in young people’s sexual and reproductive health at the state level by context-related characteristics, including relevant policies. All young people—including those not attending school—require access to a full range of contraceptive methods, to ensure that they can choose and use the methods that best meet their needs. Policies and programs that support young people’s sexual and reproductive health, including contraceptive access, are essential if adolescents are to have the resources they need to thrive. Young people’s ability to access the information and services needed to support their sexual and reproductive health should not be determined simply by where they live.
Appendix 1. Additional Notes on Data, Methods and Limitations
The data reported here are from the CDC’s biannual Youth Risk Behavior Surveillance System (YRBSS), drawing from both the national and state YRBS modules. These are conducted independently of one another. Although the national YRBS includes students in both public and private schools, the state surveys used here are designed to be representative only of students in public schools.13,14
Each YRBS questionnaire is self-administered anonymously and takes one class period to complete. The CDC provides a standard 89-item questionnaire, from which states are required to include at least 60 questions. Detailed information on the survey is published elsewhere.13
The CDC reports data from states that have a representative sample of students, as determined either by an overall response rate of 60% or more or by a nonresponse bias analysis indicating no significant bias. Data from 44 states are available from the 2019 YRBSS, more than in any prior year. Of these 44, 40 have at least one of the measures examined in this study. In total, this report includes 2019 data for at least one measure from more than 130,000 students across 40 states. Because each state YRBS varies in sample size, the precision of point estimates also varies.
We report the proportion of students who said they have ever had sexual intercourse. Among high school students who had sexual intercourse in the preceding three months, the YRBS assesses which contraceptive methods, if any, they used at last intercourse. We report the prevalence of measures of any prescription method use, any condom use and any method use overall.
Using the CDC’s Youth Online tool,15 we extracted publicly available data—including prevalence, 95% confidence intervals and sample sizes—for each state, as well as from the national YRBS. Sampling weights that yield estimates representative of students within each state were applied to account for the YRBS’s multistage, probability-based complex sample design. Design variables for the sampling stratum and cluster were also applied to obtain correct standard errors for all estimates. Weighted prevalence estimates are displayed for each state with available data, as well as the national U.S. estimates. To examine recent trends, we used paired t tests to identify changes in comparable measures for each state in 2015 and 2019.
This analysis has several limitations worth highlighting.
- Each state YRBS gathers information only from adolescents attending public high school. Those who attend private or parochial schools, who were not in school when the survey was administered or who dropped out may have different sexual and contraceptive use experiences. This makes it inappropriate to generalize these findings to a state’s overall population of adolescents.
- Ten states are not included in this analysis, either because they did not participate in the YRBSS or because they did not include the specific questions on sexual behavior and contraception in their surveys. These states represent four of the 16 states in the South, four of the 13 states in the West and two of the 12 states of the Midwest.
- The YRBSS collects a limited amount of demographic data: grade, gender, race/ethnicity and sexual identity. We did not conduct analyses across these demographic subgroups because of relatively small sample sizes within many states. Those interested can produce these subgroup estimates, with associated confidence intervals, on the CDC website using their Data Explorer.
- The YRBSS undergoes extensive design efforts and shows good reliability in test-retest analyses. Still, other evidence suggests that some respondents misreport sexual behavior data, especially in school-based surveys.16
- The method used at last intercourse is the primary contraceptive measure examined in the YRBS, but consistency of contraceptive use is not measured. Furthermore, some sexually active students may have been actively or passively seeking to become pregnant, and the YRBSS does not collect information on pregnancy intention.
- Sexual intercourse is not explicitly defined in the YRBSS.
- Our measure of hormonal methods includes males’ reports of their female partners’ method use, and as a result, this measure may be underreported.
Appendix 2. YRBS Survey Questions Used in This Analysis
Have you ever had sexual intercourse?
A. Yes
B. No
The last time you had sexual intercourse, did you or your partner use a condom?
A. I have never had sexual intercourse
B. Yes
C. No
The last time you had sexual intercourse, what one method did you or your partner use to prevent pregnancy? (Select only one response.)
A. I have never had sexual intercourse
B. No method was used to prevent pregnancy
C. Birth control pills
D. Condoms
E. An IUD (such as Mirena or ParaGard) or implant (such as Implanon or Nexplanon)
F. A shot (such as Depo-Provera), patch (such as Ortho Evra), or birth control ring (such as NuvaRing)
G. Withdrawal or some other method
H. Not sure
Footnotes
*National and state YRBS data come from separate scientific samples of schools and students. The national YRBS data are not an aggregation of the state YRBS data sets.
†Respondents were asked "Have you ever had sexual intercourse?" with no further definition or clarification provided. See Appendix 2 for all relevant survey questions.
‡Respondents were asked whether they or their partner used a condom, either alone or with another method.
§Respondents were asked if they or their partner used a prescription method, a condom, withdrawal or any "other method" at last sex.
**Twenty-nine states have data on sexual experience for both 2015 and 2019. Thirty states have data on prescription contraceptive use or condom use for both 2015 and 2019.
REFERENCES
1. Office of Disease Prevention and Health Promotion, U.S. Department of Health and Human Services (HHS), Healthy People 2030: Family Planning, 2020, https://health.gov/healthypeople/objectives-and-data/browse-objectives/….
2. Brofenbrenner U, The Ecology of Human Development: Experiments by Nature and Design, Cambridge, MA: Harvard University Press, 1979.
3. Guttmacher Institute, Minors’ access to contraceptive services, State Laws and Policies, 2020, https://www.guttmacher.org/state-policy/explore/minors-access-contracep….
4. Guttmacher Institute, Protecting confidentiality for individuals insured as dependents, State Laws and Policies, 2020, https://www.guttmacher.org/state-policy/explore/protecting-confidential….
5. Fuentes L et al., Adolescents’ and young adults’ reports of barriers to confidential health care and receipt of contraceptive services, Journal of Adolescent Health, 2018, 62:36–43, doi:10.1016/j.jadohealth.2017.10.011.
6. Lindberg LD, Santelli JS and Desai S, Changing patterns of contraceptive use and the decline in rates of pregnancy and birth among U.S. adolescents, 2007–2014, Journal of Adolescent Health, 2018, 63:253–256, doi:10.1016/j.jadohealth.2018.05.017.
7. Lindberg L, Santelli J and Desai S, Understanding the decline in adolescent fertility in the United States, 2007–2012, Journal of Adolescent Health, 2016, 59(5):577–583, doi:10.1016/j.jadohealth.2016.06.024.
8. Santelli J et al., Explaining recent declines in adolescent pregnancy in the United States: the contribution of abstinence and improved contraceptive use, American Journal of Public Health, 2007, 97(1):150–156, doi:10.2105/AJPH.2006.089169.
9. Lindberg LD, Maddow-Zimet I and Boonstra H, Changes in adolescents’ receipt of sex education, 2006–2013, Journal of Adolescent Health, 2016, 58(6):621–627, doi:10.1016/j.jadohealth.2016.02.004.
10. Centers for Disease Control and Prevention (CDC), School Health Profiles 2018: Characteristics of Health Programs Among Secondary Schools. Table 11c, 2019, https://www.cdc.gov/healthyyouth/data/profiles/pdf/2018/CDC-Profiles-20….
11. CDC, PS18-1807 Program Guidance: Guidance for School-Based HIV/STD Prevention (Component 2) Recipients of PS18-1807, Atlanta: HHS, 2019, https://www.cdc.gov/healthyyouth/fundedprograms/1807/resources/PS18-180….
12. Patton GC et al., Our future: a Lancet commission on adolescent health and wellbeing, Lancet, 2016, 387:2423–2478, doi:10.1016/ S0140-6736(16)00579-1.
13. Underwood JM et al., Overview and methods for the Youth Risk Behavior Surveillance System — United States, 2019, MMWR Morbidity and Mortality Weekly Report, 2020, 69(1):1–10.
14. CDC, Youth Risk Behavior Surveillance System (YRBSS) overview, 2020, https://www.cdc.gov/healthyyouth/data/yrbs/overview.htm.
15. CDC, High School YRBS: Youth Online, 2020, https://nccd.cdc.gov/Youthonline/App/Default.aspx.
16. Robinson-Cimpian JP, Inaccurate estimation of disparities due to mischievous responders: several suggestions to assess conclusions, Educational Researcher, 2014, 43(4):171–185, doi:10.3102/0013189X14534297.